|
Atlantis: The True Story — Anomalous Geography on Ocean Bottom Suggesting Technologically Advanced Ancient Civilization Evidence
Data Release Date: 22 April 2016 (Revised Version)
 (Free on YouTube) (Free on YouTube)
Project Summary
This is a remote-viewing investigation of a defunct, technologically advanced human civilization that once existed in the ancient past on Earth. We sometimes refer to this project as the "Atlantis Project." However, no attempt here is made to connect this project to any contemporary views relating to Atlantis mythology. Here, the word "Atlantis" is used only to represent the idea of a technologically advanced human civilization that once existed in the ancient past on Earth. Our findings suggest that this civilization did in fact destroy itself in a cataclysm that resulted from the misuse of its own science.
All remote viewing done at The Farsight Institute is conducted under totally blind conditions. The remote viewers are never given any information about or relating to the targets prior to the completion of all remote-viewing sessions for a project. To understand the differences between an operational project such as this one and a strictly scientific project (such as our Multiple Universes Project), see the discussion on our Mysteries Project main page.
Project Background and Imagery
This remote-viewing study focuses on two anomalous patterns visible on Google Earth that are located at the bottom of the ocean. The anomalous patterns seem to suggest high levels of technologically sophisticated civilization activity in the very ancient past. The Google Earth presentation of these data has occurred in two versions, which we will call Google Earth 1.0 and 2.0. Comparing the two versions, the anomalous patterns seem to diminish in Google Earth 2.0, while they are very clear in Google Earth 1.0. There is controversy with both versions. With the Google Earth 1.0 version, the anomalous patterns have been erroneously dismissed (elsewhere) as sonar imaging artifacts known as "ship tracks." With the Google Earth 2.0 version, the "ship tracks" idea has been largely dropped, and the claim has been made (again, elsewhere) that the Google Earth 2.0 imagery is "improved," and that this improvement "fixed" the anomalous imagery seen in Google Earth 1.0. However, a comparison between the two versions suggests that the Google Earth 2.0 imagery for these two anomalies has been compromised as the result of the application of extreme compression algorithms that radically diminish or in some areas eliminate color gradients (or transitional color variation as one moves across an image). Evidence of this is the appearance of extensive patches of an image that follow vertical and horizontal pixel lines in which there is no color variation, or no gradation in color. The question of whether this was done in Google Earth 2.0 for the purpose of suppressing the anomalous evidence that was clearly visible in the Google Earth 1.0 imagery is not discussed here. It is important to note that all Google Earth data in their original form are collected and distributed by the United States government. Motivations as to why any government may wish to suppress this type of evidence is similarly not addressed here. The images with the anomalies are shown below in both Google 1.0 and 2.0 versions for comparison. It is suggested that people examine the evidence presented here and come to their own conclusions.
Since there are controversies regarding the anomalous patterns found on the bottom of the ocean in Google Earth, remote viewing can be used to address the controversies by enabling direct observation of the patterns themselves on the ocean floor. In many respects, this approach would complement a future attempt to send a submarine to investigate the patterns. Remote-viewing data can also be used to help interpret data obtained from a physical investigation, since remote viewers can travel back in time to directly observe the origin of the patterns.
To ease the presentation of this material, the anomaly shown in figure 1 below is referenced as the "Atlantic Grid." The anomaly shown in figure 4 below is referenced as the "Antarctic Grid."
Principal Investigator: Courtney Brown
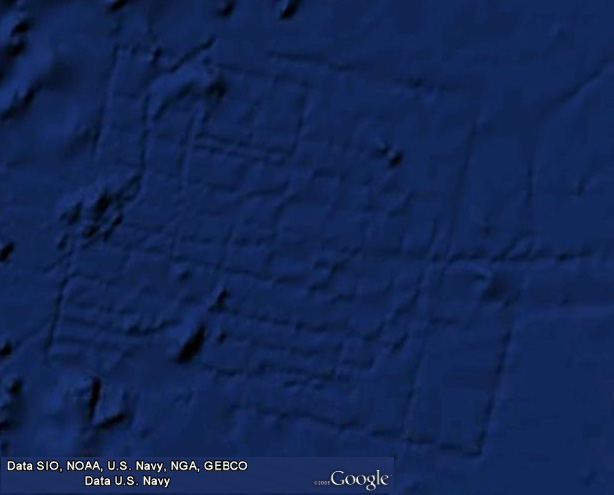 |
Figure 1:
The Atlantic Grid
(Google 1.0)
Original Google Earth 1.0 image of the Atlantic Grid on the bottom of the Atlantic Ocean off the coast of Morocco and Spain
Note the good contrast and smooth gradations in color as one moves across the image.
Latitude: 31.369723°
Longitude: -24.408799°
Elevation: -5460 meters
CLICK HERE TO LEARN WHY THESE ARE NOT SHIP TRACKS. |
| |
|
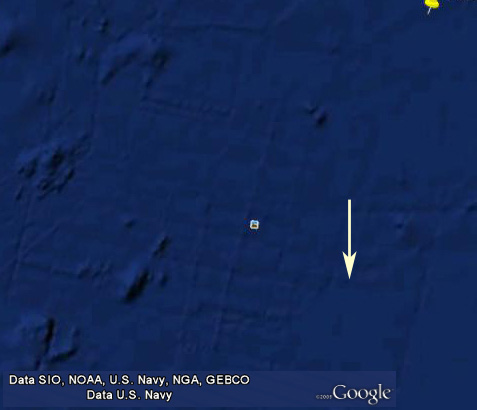 |
Figure 2:
The Atlantic Grid
(Google 2.0)
Revised Google Earth 2.0 image of the Atlantic Grid on the bottom of the Atlantic Ocean off the coast of Morocco and Spain
Note the straight-edged patches of a single color in this image, resulting in dramatic reductions in image contrast and little to no gradations in color. This is particularly obvious in the lower right portions of the image (see arrow). This is a normal result of the application of extreme compression algorithms. |
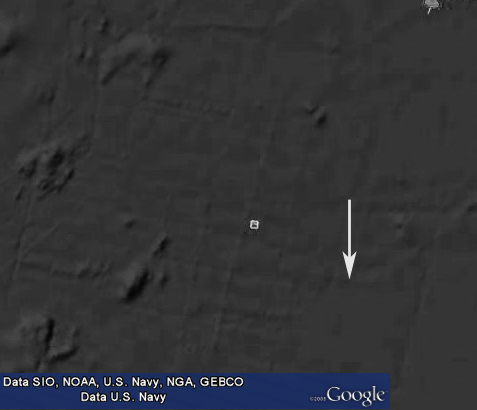 |
Figure 3: Desaturated (no color) version of figure 2 |
| |
|
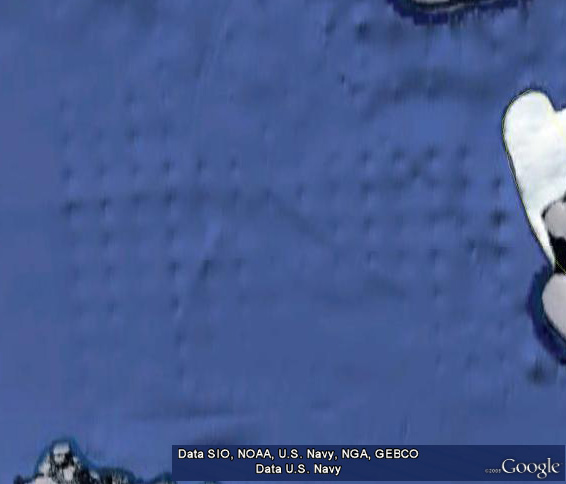 |
Figure 4:
The Antarctic Grid
(Google 1.0)
Original Google Earth 1.0 image of the Antarctic Grid on the bottom of the ocean off the coast of Antarctica
Note the nice contrast and smooth gradations in color as one moves across the image.
Latitude: -71.672286°
Longitude: -77.152573°
Elevation: -559 meters |
| |
|
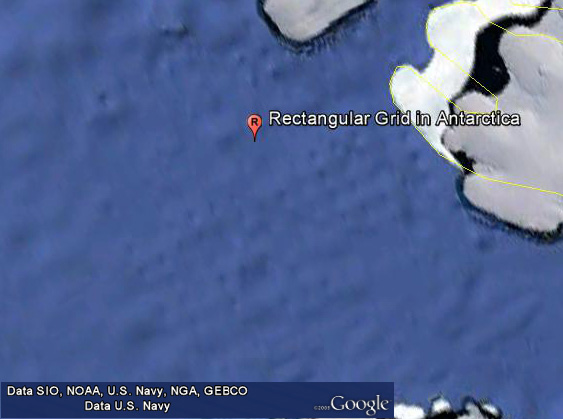 |
Figure 5:
The Antarctic Grid
(Google 2.0)
Revised Google Earth 2.0 image of the Antarctic Grid on the bottom of the ocean off the coast of Antarctica
Note the reduction in color variation and contrast in the image, a normal result of the application of extreme compression algorithms. |
The Remote-Viewing Targets
| Targets for the Atlantic Grid |
| Target #4a: The target is shown in figure 1. The target time is 7 August 2011. The viewer should explore the terrain at the bottom of the ocean as shown in the image in order to determine the meaning, cause, or significance of the patterns shown in the image. |
| Target #4b: The viewer should explore and describe what the target in figure 1 looked like before it was located at the bottom of the Atlantic Ocean. The target time should be when whatever caused the patterns shown in the image below was at its peak or optimal state. |
| Target #4c: The viewer should explore and describe the event or process that resulted in the target to be located at the bottom of the ocean, as shown in figure 1. The target time should be the time that best reveals the cause and nature of the event or process. |
| |
| Targets for the Antarctic Grid |
| Target #4d: The target is shown in figure 4. The target time is 7 August 2011. The viewer should explore the terrain at the bottom of the ocean as shown in the image in order to determine the meaning, cause, or significance of the patterns shown in the image. |
| Target #4e: The viewer should explore and describe what the target in figure 4 looked like when whatever caused the patterns shown in the image was at its peak or optimal state. |
| Target #4f: The viewer should explore and describe the event or process that resulted in the target to be located at the bottom of the ocean, as shown in figure 4. The target time should be the time that best reveals the cause and nature of the event or process. |
| |
| Target for Point of Origin of Cause |
| Target #4g: The viewer should explore and describe the point of origin that triggered, and thus initiated, the event or process that resulted in the target to be located at the bottom of the ocean, as shown in figure 4. The target time should be the time that best reveals the cause and nature of the event or process. |
|
 (with summary and comments for each session) (with summary and comments for each session) |
| |
|