HERE ARE PAST FORECASTS WITH ANALYSES FOR VARIOUS CRYPTOCURRENCIES
Disclaimer: No one at Farsight is a licensed financial advisor. So anything that anyone at Farsight does that relates to using remote-viewing to predict financial or economic outcomes of any type, including the performance (however defined) or selling prices of cryptocurrencies, stocks, commodities, or anything else, is done for entertainment and educational purposes only. Everyone doing investments are doing so at their own risk. These are experiments in remote viewing, and there are no guarantees or warranties being made, either expressed or implied. Nonetheless, these efforts are truly interesting on a grand scale, and we at Farsight believe that after we do this for awhile, it will be hard for anyone to ignore the reality of remote viewing.
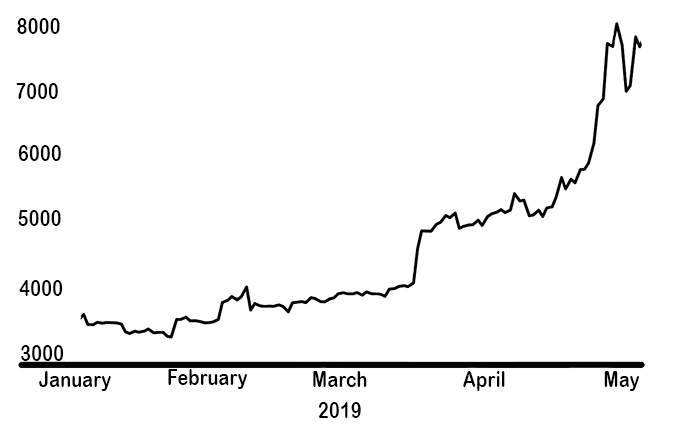
Bitcoin (BTC): 20 January 2019 through 20 May 2019
Prediction
Positive
Result
Negative
Result
RV Data
Interpretation
of Data
Upward price movement will dominate this forecast period
X
Good
Correct
Price rises should be at least three times the size of any price declines
X
Good
Correct
The high should occur before the low.
X
Good
Correct
The high should occur before March 20th
X
Unclear
Incorrect
Details: Bitcoin: 20 January 2019 through 20 May 2019 Prediction: The price reference date for this forecast is 18 January 2019. Price rises and declines are measured as percentages of the base reference price of $3674, which was the Bitcoin price on that date. During the forecast period, price rises should be approximately $1903. Price declines should be approximately $539. Price rises are higher than price declines, so the forecast period should show significant positive growth in Bitcoin pricing that is at least three times the size of any decline. Also, the high in pricing should occur before the low. Result: The prediction of upward price movement significantly dominating any downward movement exactly matched what happened during this forecast period. Moreover, the greatest downward movement in pricing occurred between June 3rd and June 4th, a $920 drop which occurred after the high was achieved as predicted. However, the forecast stated that the high should occur before March 20th, which was incorrect.
Ripple (XRP): 21 December 2018 through 21 April 2019
Prediction
Positive
Result
Negative
Result
RV Data
Interpretation
of Data
Downward price movement will dominate this forecast period
X
Good
Correct
Higher prices will occur from 21 December 2018 through 21 January 2019, as well as during the first three weeks of April
X
Good
Correct
Downward price movements will dominate between 21 January 2019 through March 2019
X
Good
Correct
Details:
Ripple: 21 December through 21 April 2019
Prediction: Downward price movement will dominate this forecast period. Higher prices will occur in the beginning and end of the forecast period, whereas lower prices will dominate in the middle from 21 January through March 2019.
Result:
The prediction exactly matched the price movement of Ripple (XRP) during this forecast period. Downward price movement dominated, and the dates of the high and low prices were correct.
Litecoin (LTC): 18 November 2018 through 18 March 2019
Prediction
Positive Result
Negative Result
RV Data
Interpretation
of Data
Price rises will be greater than losses, although not by much
X
Good
Correct
Predicted price rise: $25
Actual rise: $37
X
Good
Correct
Predicted price drop: $22
Actual drop: $19
X
Good
Correct
Details:
Litecoin: 18 November 2018 through 18 March 2019 Prediction: The price reference date for this forecast is 16 November 2019. Price increases will be greater than the losses, but they will be similar in magnitude. Expectations are a price rise of $25 and a price drop of $22. Timing: Result: The highest price for Litecoin for this forecast period was on 18 March 2019, and that price was $60. The lowest price was on 15 December 2018, and that price was $23. The predicted price rise was $25. The predicted price drop was $22. The low happened before the high, and the drop from the price on the start of the forecast was $19. Since the rise happened after the drop, the rise to $60 from the low of $23 was a total of $37. The price rises were greater than the losses, as predicted.
Ethereum (ETH): 18 October 2018 through 18 January 2019
Prediction
Positive Result
Negative Result
RV Data
Interpretation
of Data
There will be a "U-Shaped" pricing curve.
X
Good
Correct
First high will occur between mid-October and mid-November
X
Good
Correct
Second high will occur between mid-December 2018 and mid-January 2019
X
Good
Correct
Low will occur between mid-November and mid-December
X
Good
Correct
Details: ETHEREUM: 18 October 2018 through 18 January 2019 Prediction: The prediction was for a U-shaped pricing curve. Prices were predicted to rise modestly in the beginning of the forecase period, then drop in the middle, and then rise again at the end of the forecast period. Gains will average between $72-$126
Declines will average between $60--$114
Timing: Highs between mid-October and mid-November, and again between mid-December 2018 and mid-January-2019 Result: The pricing changes during this forecast exactly matched the predicted price dynamics, with a U-shaped pricing curve. The rises happened at the predicted times, and the low occurred at the predicted time. The high-risk predicted price changes were the closest to the actual price changes.
Actual largest gains were
approximately $76, from December 15 ($83) to January 6 ($159)
Actual largest losses were approximately $124, from October 18 ($207) to December 15 ($83)
Bitcoin: 15 August through 15 November 2018
Prediction
Positive Result
Negative Result
RV Data
Interpretation
of Data
General constancy in pricing throughout forecast period mixed with one or two upward price movements
X
Good
Correct
Eventual rise in pricing late in forecast period
X
Good
Incorrect
Timing: Highs will occur in second half of forecast period
X
Unclear
Incorrect
Details: BITCOIN: 15 August through 15 November 2018 Prediction: The prediction was for generally stable or constant overall prices during the forecast period, mixed with potentially two upward spikes in the price in Bitcoin. There was no prediction of a serious drop in Bitcoin prices during the forecast period. Timing: Highs will likely occur in the second half of the forecast period. Result: The pricing changes in this forecast period were very complex, but they closely matched most of the forecast until the very end. Price rises or constancy dominated the first 90 out of 92 days of the forecast period. There was a steep rise in the price of Bitcoin between August 15 through September 5. After that, there was constancy in the price until the last two days of the forecast period. Thus, for 98% of the forecast period, the forecast was generally correct. The only major error was with the timing of the forecasted price rise, which happened early in the forecast period rather than late. But on the last two days of the forecast period (November 14 and 15), there was a significant drop in the price of Bitcoin, which was not predicted in the forecast. The remote viewing picked up the dominant elements for this period, which were constancy and rising prices that dominated 98% of the entire forecast period. In retrospect, the remote viewing data did describe two spikes in the price of Bitcoin, one good and one bad. But an interpretation error on the part of the analyst interpreted the data to indicate two upward spikes.
NOTE: The serious drop in Bitcoin pricing that occurred after November 15 was outside of the time span for this forecast.
Ethereum: 15 July through 15 October 2018
Prediction
Positive Result
Negative Result
RV Data
Interpretation
of Data
Previous downturn will continue.
Strong downward movement late in forecast period
X
Good
Correct
Prices move upward late in forecast period
X
Good
Incorrect
Timing: Low prices will bottom out between August 31 through September 15
X
Good
Correct
Significant volatility
X
Good
Correct
Details: ETHEREUM: 15 July through 15 October 2018 Prediction: Previous downturn in Ethereum pricing will continue. There will be strong downward movement in pricing together with significant volatility and rapid changes. This will be followed by upward movement in pricing late in the forecast period. Timing: Low prices will bottom out from August 31 through September 15. Result: Prediction of continued decline in Ethereum pricing that bottoms out between August 31 through September 15 was highly accurate. The prediction of significant volatility was accurate. The predicted subsequent upswing in pricing did not occur. This was due to interpretation errors of the remote-viewing data. The raw data (correctly interpreted after the fact) indicated strong downward threats to Ethereum pricing.
Litecoin: 15 June through 15 September 2018
Prediction
Positive Result
Negative Result
RV Data
Interpretation
Steep pricing decline
X
Good
Correct
Significant volatility
X
Good
Correct
Details: LITECOIN: 15 June through 15 September 2018 Prediction: Predicted steep decline, with significant volatility
June 24 reference price: $101
Drop: LR: 24% drop
HR: 51% drop, from price reference data price to $49
Volatility: Moderate to Severe
Actual: 51% drop, $49 on September 12
Rise: LR: 18% rise
HR: 45% rise
Volatility: minor Result Summary: Predicted steep decline was very accurate, HR predictions were highly accurate, plus moderate to severe volatility was highly accurate
NOTE: LR = Low Risk, HR = High Risk
BITCOIN: 15 May through 15 August 2018
Prediction
Positive Result
Negative Result
RV Data
Interpretation
General pricing constancy
X
Good
Correct
Moderate volatility
X
Good
Correct
Details: BITCOIN: 15 May through 15 August 2018 Prediction: General pricing constancy, minor volatility
May 15 reference price: $8,548
Drop: LR: 24% drop, from price reference date price to $6,496, bracket [9%, 36%]
HR: 52% drop, from price reference data price to $4103, bracket [36%, 64%]
Actual: 31% drop, $5,809 on June 24th
Rise: LR: 21% rise, from predicted low, to $8291, bracket [9%, 36%]
HR: 48% rise, from predicted low, to $10,599, bracket [36%, 64%]
Actual: 21% rise, $8314 on July 24th Result Summary: General pricing constancy was accurate, LR predictions were highly accurate, volatility was minor
NOTE: LR = Low Risk, HR = High Risk
Disclaimer: No one at Farsight is a licensed financial advisor. So anything that anyone at Farsight does that relates to using remote-viewing to predict financial or economic outcomes of any type, including the performance (however defined) or selling prices of cryptocurrencies, stocks, commodities, or anything else, is done for entertainment and educational purposes only. Everyone doing investments are doing so at their own risk. These are experiments in remote viewing, and there are no guarantees or warranties being made, either expressed or implied. Nonetheless, these efforts are truly interesting on a grand scale, and we at Farsight believe that after we do this for awhile, it will be hard for anyone to ignore the reality of remote viewing.